

Technical Analysis Studio — Orange, NSW

Decode Market Structure with Moving Average Ribbons & Momentum Setups.

Next Layer Hub delivers rigorous, hands-on technical analysis training for independent traders and market technicians. Learn to filter out market noise, verify breakout momentum, and execute disciplined trade management using proven multi-timeframe frameworks.

Location Orange, NSW & Live Cohorts
Class Size Max 12 Seats per Workshop
Focus EMA Ribbons & Momentum
Active candlestick price charts and technical indicators on high-resolution displays
Live Charting Laboratory
Real-time market teardowns, indicator calibration, and trade journal reviews
Core Analytical Framework

Systematic Charting Principles Grounded in Market Geometry

Rather than relying on vague intuition or lagging single-indicator signals, our curriculum teaches a structured four-layer technical framework designed for high-conviction decision making.

EMA Ribbon Geometry

Evaluate 8, 21, 55, and 200 EMA compression, fanning expansion, and mean-reversion pullbacks to identify dominant trend velocity.

Momentum Divergence

Identify subtle regular reversal signals and hidden continuation divergence across RSI and MACD histograms before price exhaustion occurs.

Volume Acceptance

Confirm price moves using relative volume thresholds (1.5x VMA) to filter out deceptive institutional liquidity traps and false breakouts.

Calculated Invalidation

Establish clear mathematical invalidation points using Average True Range (ATR) multiples and structural swing pivots before entering positions.

Flagship Training Cohort

Moving Average & Momentum Masterclass

A structured 4-week cohort program combining live classroom instruction in Orange, NSW with hands-on midweek chart diagnostics.

Develop a personalized, written technical playbook. Learn the exact criteria for entering pullbacks into the 21 EMA dynamic zone, managing trailing stops through volatility contractions, and spotting multi-timeframe divergence with complete confidence.

16 Hours of interactive charting drills & live market reviews
Individual 1-on-1 trade journal audit with Sophie Mitchell
Spiral-bound 180-page Technical Analysis Reference Handbook
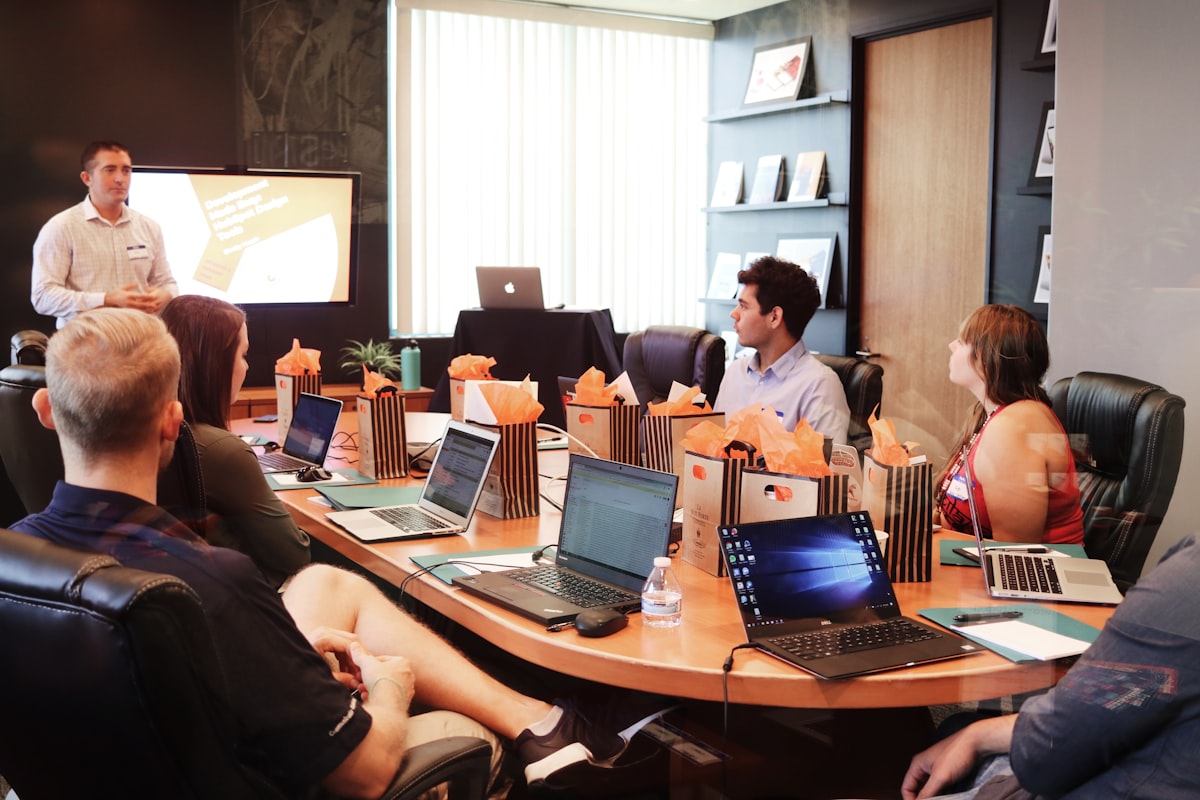
Analyst team examining technical setups and market dynamics
Next Cohort Starts: First Monday of Next Month
Format: Orange Studio / Virtual Live Feed
Training Catalog

Workshops, Clinics & Diagnostic Sessions

View All Programs →
Technical analyst reviewing printed chart patterns and handwritten trade notes with a client Private Mentoring

1-on-1 Chart Diagnostics & Setup Clinic

An intensive one-on-one diagnostic session to audit your moving average parameters, momentum timing, entry precision, and risk management habits.

  • Duration: 90 Minutes Dedicated Consultation + Written Diagnostic Report
  • Format: In-Person in Orange NSW or Private Live Video Session
  • Price Basis: $320 AUD per clinic session
View Full Scope
Financial training workshop room with attendees analyzing price volume charts on laptops Weekend Intensive

Multi-Timeframe Trend & Volume Immersion

Learn how top technicians align weekly moving averages with daily momentum triggers and volume confirmation to avoid low-probability chop.

  • Duration: 1 Full Day (Saturday 9:00 AM – 5:00 PM)
  • Format: In-Person Workshop in Orange, NSW (Small Group, Max 10)
  • Price Basis: $780 AUD per attendee (Catering & Materials Included)
View Full Scope
Professional financial team collaborating over technical market charts on a conference screen Custom Corporate & Desk Training

Boutique Group & Team Charting Workshops

Tailored training delivered on-site across regional and metropolitan NSW, equipping teams with standardized chart interpretation and risk terminology.

  • Duration: 1 to 3 Days Custom Schedule
  • Format: On-Site at your offices or dedicated venue in NSW
  • Price Basis: Custom quote based on group size and tailored syllabus
View Full Scope
Practitioner Feedback

What Traders Say About Our Technical Workshops

Hear from regional Australian traders, analysts, and commodity technicians who refined their charting discipline at Next Layer Hub.

Clear rules for exponential ribbon pullbacks instead of guesswork

"Before Sophie's 4-week cohort, I was constantly jumping between fifteen different indicator settings on TradingView. The ribbon framework (8/21/55 EMA) gave me an objective, repeatable way to identify when an equity is actually in a momentum trend rather than a choppy consolidation. The weekly live chart teardowns were thorough, and having Sophie directly review my written journal forced me to stick to strict invalidation stops."

Marcus Callahan
Private Swing Trader (ASX Equities) • Bathurst, NSW

Rigorous multi-timeframe methodology, though day one is very dense

"The Orange weekend immersion was intensely practical. We spent hours dissecting volume exhaustion candles and RSI hidden divergence across weekly and 4-hour charts. My only critique is that the first three hours moved at a very rapid clip through mathematical derivations of exponential weighting, which required heavy concentration before we got to live chart examples. Once we transitioned to real chart drills in the afternoon, everything clicked into place."

Elena Rostova
Commodity Risk Analyst • Sydney, NSW
Note: Intense technical pace during morning theory before live charting drills

Pinpointed why my momentum entries were getting stopped out

"I booked the 90-minute 1-on-1 clinic because I kept buying bullish RSI crosses right into major 200-day simple moving average overhead resistance. Sophie reviewed my last 15 trade logs line by line, showed me how to spot volume distribution signatures, and helped me reset my charting template. The written diagnostic report she provided afterwards is now taped to my trading desk."

David Henderson
Agricultural Business Owner & Futures Trader • Dubbo, NSW
Read More Student Reviews →
Technical Knowledge Base

Recent Field Notes & Chart Studies

Browse All Guides →
Questions Answered

Frequently Asked Questions

Answers to common questions regarding course prerequisites, delivery formats, and charting tools.

Our training focuses on universal technical analysis principles that apply to any standard charting software, including TradingView, MetaTrader, TrendSpider, StockCharts, or broker-provided platforms. We provide pre-configured indicator scripts and setup parameters for standard platforms, but the analytical logic is completely platform-agnostic.

Next Layer Hub operates exclusively as an educational training institution. We teach you how to independently analyze price action, identify momentum setups, calculate risk-to-reward parameters, and manage your own trading execution.

In-person workshops, weekend intensives, and 1-on-1 diagnostic clinics are conducted at our dedicated training studio at 42 Demo Rd in Orange, NSW. We also offer interactive virtual cohort access via high-definition live classroom feeds for participants located across regional Australia or interstate.

Basic moving average crossover systems (such as a 9/21 cross) generate excessive whipsaws during sideways consolidations. Our multi-EMA ribbon framework evaluates three distinct structural states: compression, expansion, and overextension. We use the ribbon as dynamic trend support and pair it with momentum oscillator confirmation (RSI/MACD) and volume verification before considering an entry.

Participants should have basic familiarity with reading candlestick charts and placing standard market/limit/stop orders. You do not need an advanced mathematics background or years of trading experience. The 4-week syllabus is structured progressively from indicator mechanics to advanced multi-timeframe risk execution.

In-person masterclasses and weekend workshops in Orange are strictly capped at 10 to 12 participants per cohort. This ensures that every attendee receives hands-on chart reviews, direct instructor feedback on trade journals, and ample time to work through individual market questions.

In-Person & Live Online Training

Ready to Build Repeatable Chart Discipline?

Inquire about upcoming workshop dates at our Orange training studio or schedule a 1-on-1 chart diagnostics clinic with Sophie Mitchell.

Submit Training Inquiry Explore Full Curriculum

